Is San Antonio or Seattle Safer?
According to crimebycity.com's analysis of 2024 FBI data, San Antonio is safer than Seattle (Safety Score 3/100 vs 2/100), with a total crime rate of 5,219 per 100,000 versus 5,783 for Seattle — 10% lower. San Antonio has lower rates in 5 of 7 crime categories.
The biggest difference is in robbery, where San Antonio has a 51% lower rate.
San Antonio — 5-Year Trend
 Violent
 Property
 Total
Total
Seattle — 5-Year Trend
Violent
Property
Total
San Antonio, TX
Seattle, WA
Detailed Crime Rate Comparison
| Crime Type | San Antonio | Seattle | Difference |
|---|---|---|---|
| Total Crime Rate | 5,219.0 | 5,783.1 | -564.2 |
| Violent Crime Rate | 595.3 | 775.5 | -180.1 |
| Murder Rate | 8.4 | 6.8 | +1.6 |
| Rape Rate | 83.7 | 46.3 | +37.4 |
| Robbery Rate | 108.4 | 220.6 | -112.3 |
| Aggravated Assault Rate | 393.7 | 501.3 | -107.5 |
| Property Crime Rate | 4,623.6 | 5,007.6 | -384.0 |
| Burglary Rate | 495.6 | 1,152.0 | -656.5 |
| Larceny-Theft Rate | 3,291.8 | 2,882.0 | +409.8 |
| Motor Vehicle Theft Rate | 836.3 | 973.6 | -137.3 |
All rates per 100,000 residents. Source: FBI UCR 2024.
Frequently Asked Questions
Is San Antonio or Seattle safer?
San Antonio is safer with a total crime rate of 5,219 per 100K vs 5,783 for Seattle — a 10% difference.
How do violent crime rates compare?
San Antonio has a violent crime rate of 595.3 per 100K while Seattle has 775.5. San Antonio has lower violent crime.
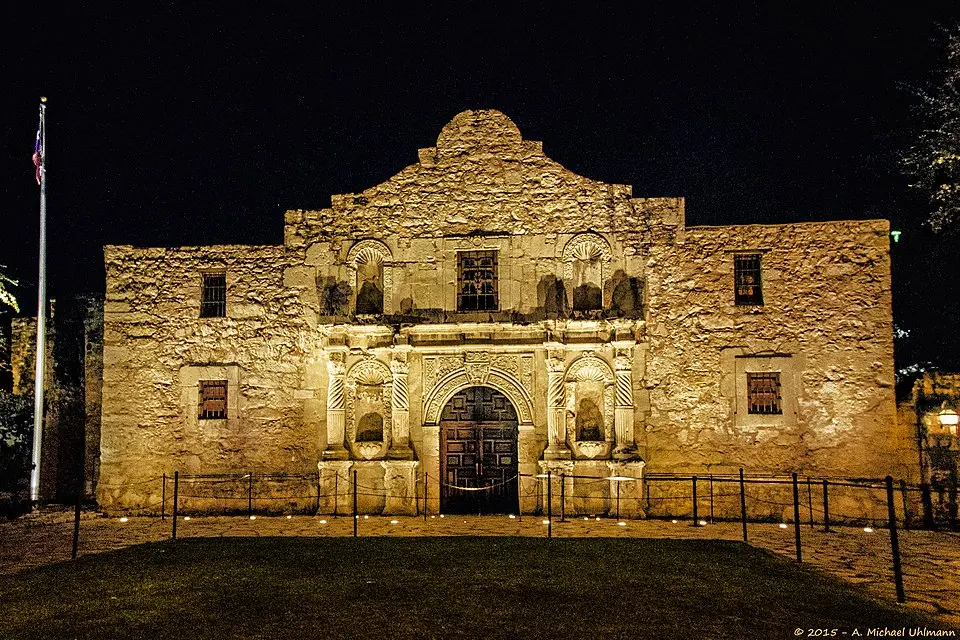
About San Antonio, TX
San Antonio, a South Texas city famed for the Alamo, sits along the Balcones Escarpment. Its population is predominantly Hispanic, reflecting a rich blend of cultures. With a safety score of 3/100 and a population coverage of 1,514,458, San Antonio has a total crime rate of 5,219.0 per 100,000 residents.
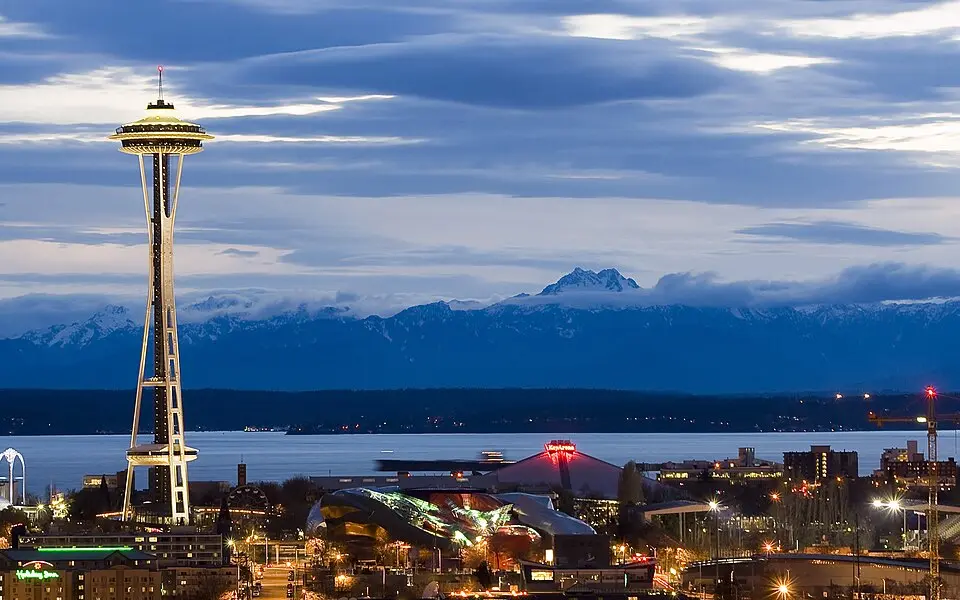
About Seattle, WA
Seattle, a major port city in the Pacific Northwest, is known for its vibrant music scene, particularly grunge, which emerged here. Situated on an isthmus between Puget Sound and Lake Washington, it’s home to a diverse population with a strong tech industry presence. With a safety score of 2/100 and a population coverage of 760,058, Seattle has a total crime rate of 5,783.1 per 100,000 residents.