Is Chicopee or Garfield Heights Safer?
According to crimebycity.com's analysis of 2024 FBI data, Chicopee is safer than Garfield Heights (Safety Score 32/100 vs 32/100), with a total crime rate of 2,327 per 100,000 versus 2,334 for Garfield Heights — 0% lower. Chicopee has lower rates in 4 of 7 crime categories.
The biggest difference is in robbery, where Chicopee has a 50% lower rate.
Chicopee — 5-Year Trend
 Violent
Property
Total
Violent
Property
Total
Garfield Heights — 4-Year Trend
Violent
Property
Total
Chicopee, MA
Garfield Heights, OH
Detailed Crime Rate Comparison
| Crime Type | Chicopee | Garfield Heights | Difference |
|---|---|---|---|
| Total Crime Rate | 2,327.4 | 2,334.1 | -6.7 |
| Violent Crime Rate | 566.6 | 464.1 | +102.6 |
| Murder Rate | 7.2 | 6.9 | +0.2 |
| Rape Rate | 86.1 | 55.4 | +30.7 |
| Robbery Rate | 41.2 | 83.1 | -41.9 |
| Aggravated Assault Rate | 432.1 | 318.6 | +113.5 |
| Property Crime Rate | 1,760.8 | 1,870.1 | -109.3 |
| Burglary Rate | 202.6 | 287.4 | -84.8 |
| Larceny-Theft Rate | 1,344.8 | 1,250.2 | +94.6 |
| Motor Vehicle Theft Rate | 213.4 | 332.5 | -119.1 |
All rates per 100,000 residents. Source: FBI UCR 2024.
Frequently Asked Questions
Is Chicopee or Garfield Heights safer?
Chicopee is safer with a total crime rate of 2,327 per 100K vs 2,334 for Garfield Heights — a 0% difference.
How do violent crime rates compare?
Chicopee has a violent crime rate of 566.6 per 100K while Garfield Heights has 464.1. Garfield Heights has lower violent crime.
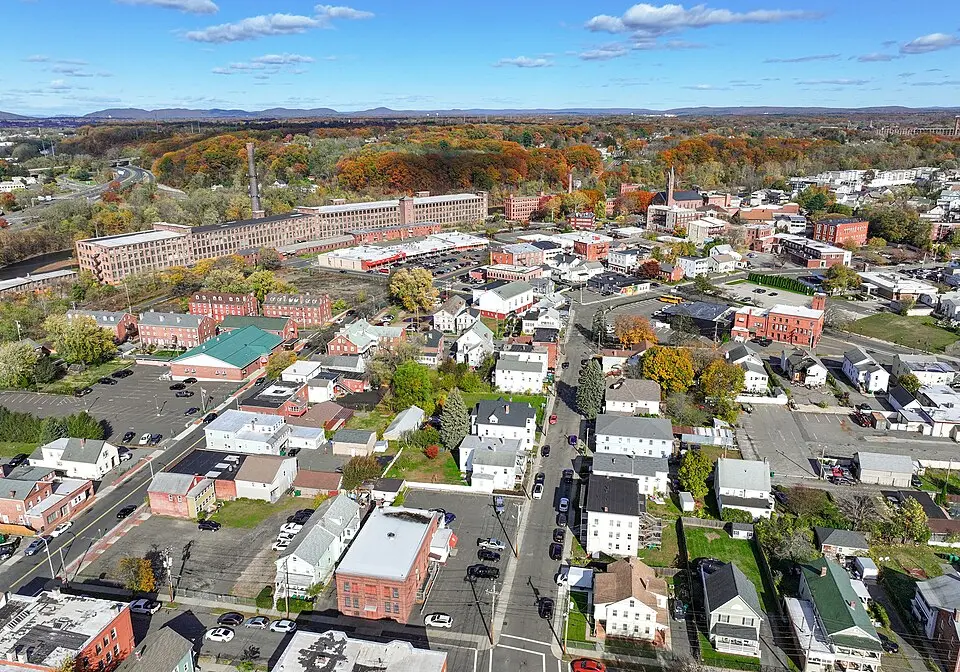
About Chicopee, MA
Chicopee, a city in Hampden County at the confluence of the Chicopee and Connecticut Rivers, was once a major textile manufacturing center. Its diverse population includes a significant Polish-American community, reflected in local businesses and cultural events. With a safety score of 32/100 and a population coverage of 55,770, Chicopee has a total crime rate of 2,327.4 per 100,000 residents.
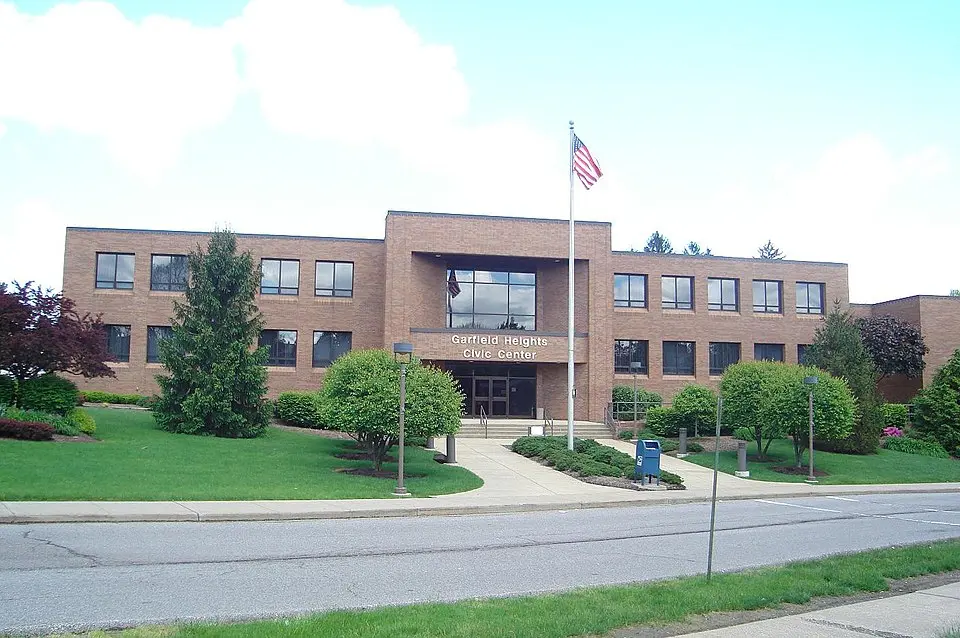
About Garfield Heights, OH
Garfield Heights, a southern suburb of Cleveland, boasts a rich history tied to its early agricultural roots. This Cuyahoga County city is home to a diverse population, with a significant percentage of its residents identifying as Black or African American. With a safety score of 32/100 and a population coverage of 28,876, Garfield Heights has a total crime rate of 2,334.1 per 100,000 residents.