Is Fall River or Ontario Safer?
According to crimebycity.com's analysis of 2024 FBI data, Ontario is safer than Fall River (Safety Score 38/100 vs 37/100), with a total crime rate of 2,090 per 100,000 versus 2,137 for Fall River — 2% lower. Fall River has lower rates in 4 of 7 crime categories.
The biggest difference is in violent crime, where Ontario has a 63% lower rate.
Fall River — 5-Year Trend
 Violent
 Property
 Total
Total
Ontario — 5-Year Trend
Violent
Property
Total
Fall River, MA
Ontario, CA
Detailed Crime Rate Comparison
| Crime Type | Fall River | Ontario | Difference |
|---|---|---|---|
| Total Crime Rate | 2,136.6 | 2,089.7 | +46.9 |
| Violent Crime Rate | 745.0 | 272.2 | +472.7 |
| Murder Rate | 3.1 | 2.2 | +1.0 |
| Rape Rate | 60.7 | 43.8 | +16.9 |
| Robbery Rate | 100.5 | 77.4 | +23.1 |
| Aggravated Assault Rate | 578.6 | 148.8 | +429.8 |
| Property Crime Rate | 1,391.6 | 1,817.5 | -425.9 |
| Burglary Rate | 231.2 | 238.7 | -7.4 |
| Larceny-Theft Rate | 996.1 | 1,113.3 | -117.2 |
| Motor Vehicle Theft Rate | 164.3 | 465.5 | -301.2 |
All rates per 100,000 residents. Source: FBI UCR 2024.
Frequently Asked Questions
Is Fall River or Ontario safer?
Ontario is safer with a total crime rate of 2,090 per 100K vs 2,137 for Fall River — a 2% difference.
How do violent crime rates compare?
Fall River has a violent crime rate of 745.0 per 100K while Ontario has 272.2. Ontario has lower violent crime.
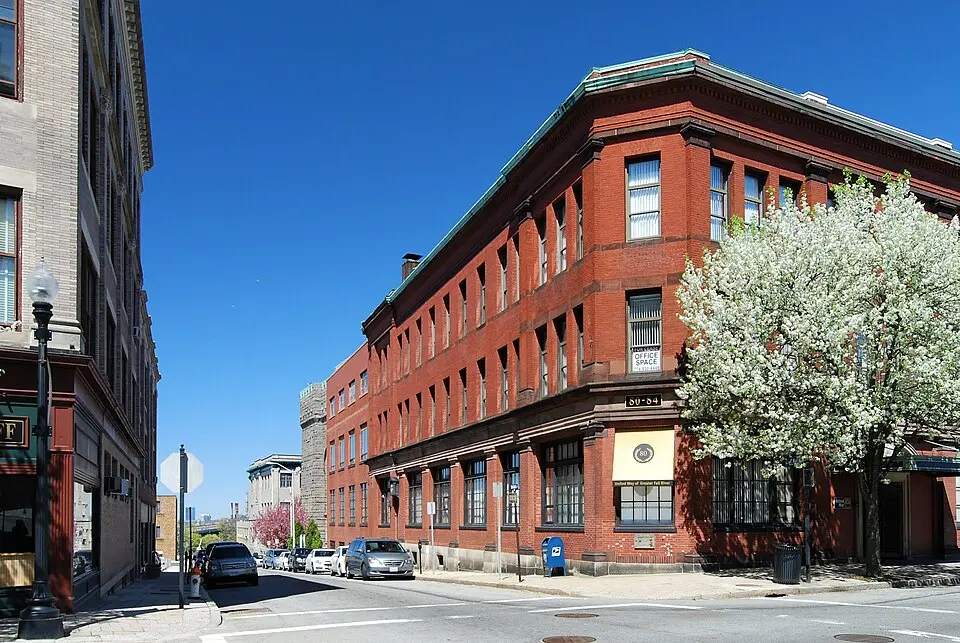
About Fall River, MA
Fall River, site of the infamous Lizzie Borden case, is a South Coast Massachusetts city nestled along the Taunton River. Once a major textile center, its population is now largely working-class, with a significant Portuguese heritage. With a safety score of 37/100 and a population coverage of 95,573, Fall River has a total crime rate of 2,136.6 per 100,000 residents.
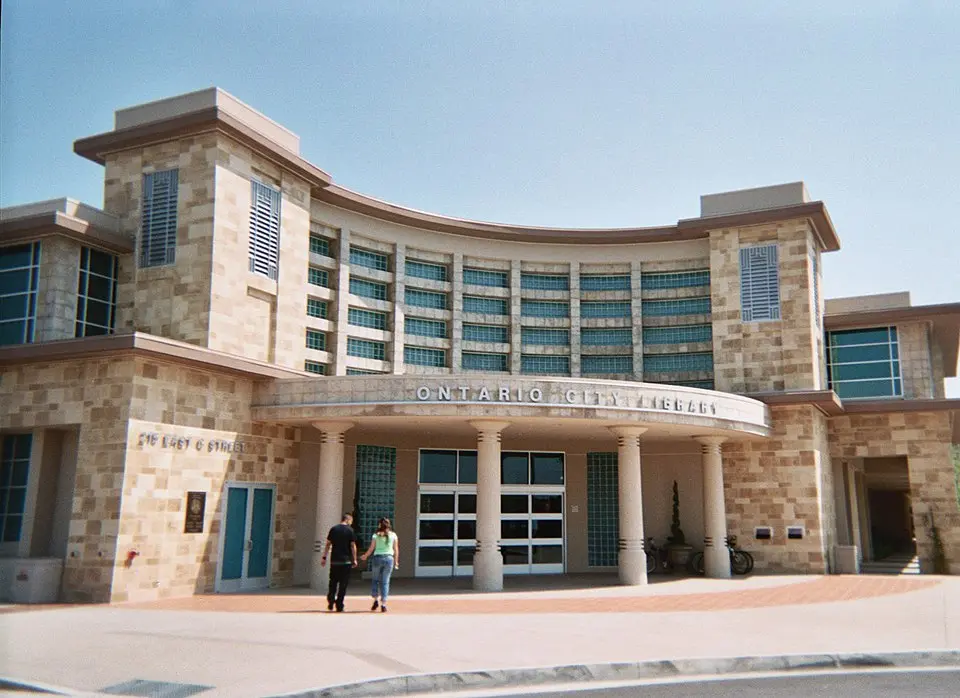
About Ontario, CA
Ontario, California, once known for its citrus groves and "Model Colony" design, sits in the Inland Empire. This diverse city, home to over 180,000 residents, serves as a logistics hub for Southern California. With a safety score of 38/100 and a population coverage of 184,763, Ontario has a total crime rate of 2,089.7 per 100,000 residents.