Is Fremont or Irving Safer?
According to crimebycity.com's analysis of 2024 FBI data, Irving is safer than Fremont (Safety Score 29/100 vs 28/100), with a total crime rate of 2,475 per 100,000 versus 2,525 for Fremont — 2% lower. Fremont has higher rates in 3 of 7 crime categories.
The biggest difference is in murder, where Fremont has a 64% lower rate.
Fremont — 5-Year Trend
 Violent
Property
Total
Violent
Property
Total
Irving — 5-Year Trend
Violent
 Property
Total
Property
Total
Fremont, CA

Irving, TX
Detailed Crime Rate Comparison
| Crime Type | Fremont | Irving | Difference |
|---|---|---|---|
| Total Crime Rate | 2,524.7 | 2,474.6 | +50.1 |
| Violent Crime Rate | 197.1 | 275.8 | -78.7 |
| Murder Rate | 2.7 | 7.4 | -4.7 |
| Rape Rate | 16.0 | 53.6 | -37.6 |
| Robbery Rate | 64.5 | 57.1 | +7.4 |
| Aggravated Assault Rate | 112.5 | 157.3 | -44.8 |
| Property Crime Rate | 2,327.6 | 2,198.8 | +128.9 |
| Burglary Rate | 342.9 | 250.1 | +92.8 |
| Larceny-Theft Rate | 1,444.7 | 1,521.8 | -77.1 |
| Motor Vehicle Theft Rate | 540.0 | 426.9 | +113.1 |
All rates per 100,000 residents. Source: FBI UCR 2024.
Frequently Asked Questions
Is Fremont or Irving safer?
Irving is safer with a total crime rate of 2,475 per 100K vs 2,525 for Fremont — a 2% difference.
How do violent crime rates compare?
Fremont has a violent crime rate of 197.1 per 100K while Irving has 275.8. Fremont has lower violent crime.
About Fremont, CA
Fremont, a diverse East Bay city, is home to the historic Mission San José. Nestled against the Diablo Range foothills, it boasts a significant Asian population and a robust tech industry. With a safety score of 28/100 and a population coverage of 224,820, Fremont has a total crime rate of 2,524.7 per 100,000 residents.
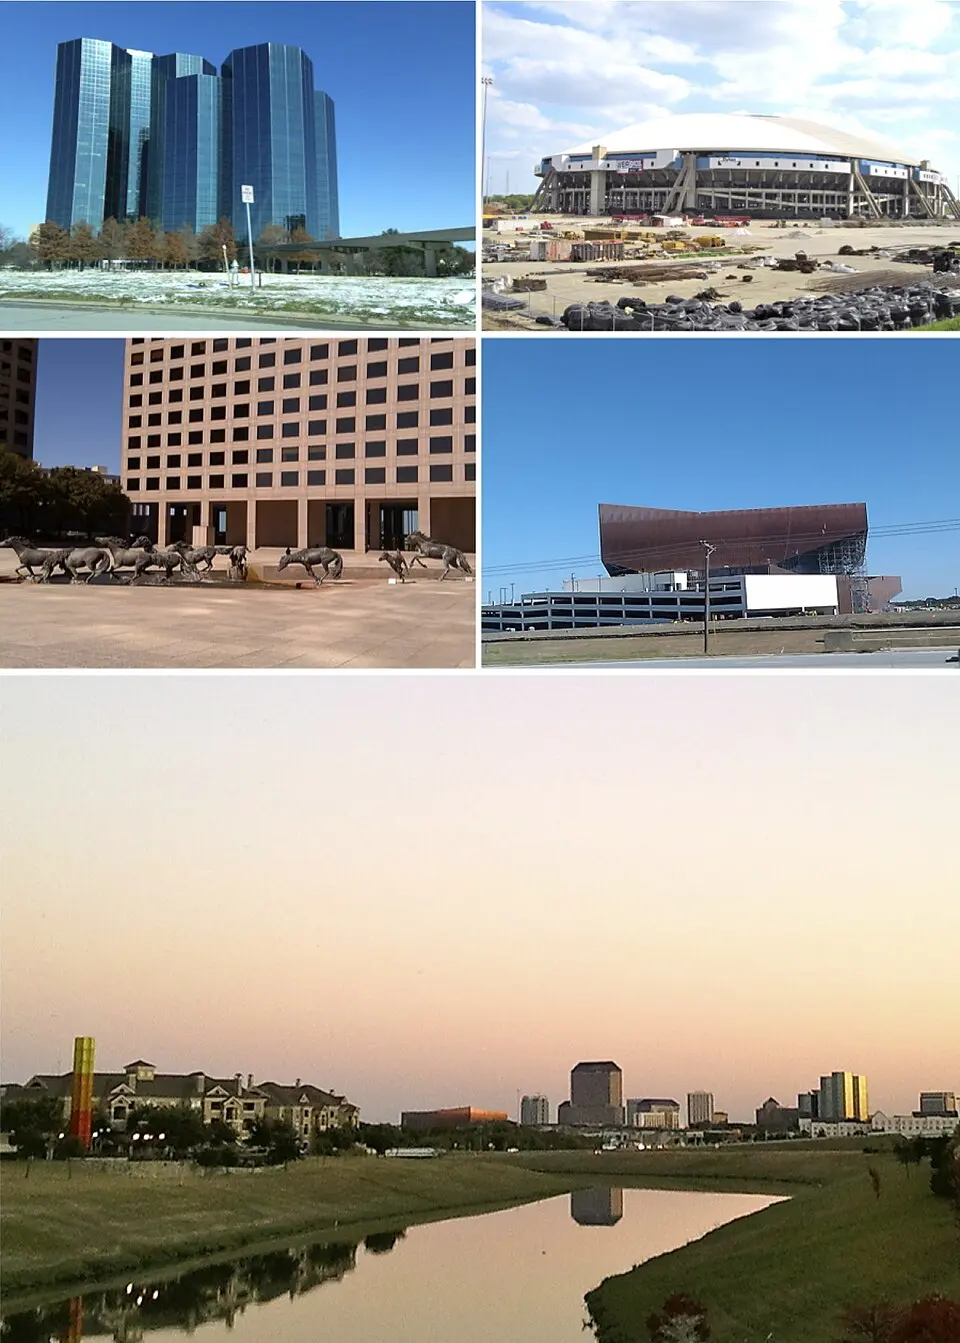
About Irving, TX
Irving, Texas, a principal city in the Dallas–Fort Worth metroplex, is home to the Las Colinas urban development. Its diverse population reflects a blend of residential areas and significant corporate presences, including Fortune 500 companies. With a safety score of 29/100 and a population coverage of 257,460, Irving has a total crime rate of 2,474.6 per 100,000 residents.