Is Lower Providence Township or New Milford Safer?
According to crimebycity.com's analysis of 2024 FBI data, New Milford is safer than Lower Providence Township (Safety Score 90/100 vs 90/100), with a total crime rate of 567 per 100,000 versus 574 for Lower Providence Township — 1% lower. Lower Providence Township has higher rates in 2 of 6 crime categories.
The biggest difference is in robbery, where New Milford has a 54% lower rate.
Lower Providence Township — 4-Year Trend
 Violent
Property
Total
Violent
Property
Total
New Milford — 5-Year Trend
Violent
Property
Total
Lower Providence Township, PA
New Milford, CT
Detailed Crime Rate Comparison
| Crime Type | Lower Providence Township | New Milford | Difference |
|---|---|---|---|
| Total Crime Rate | 573.6 | 567.4 | +6.3 |
| Violent Crime Rate | 27.0 | 28.2 | -1.2 |
| Murder Rate | 0.0 | 0.0 | +0.0 |
| Rape Rate | 0.0 | 17.6 | -17.6 |
| Robbery Rate | 7.7 | 3.5 | +4.2 |
| Aggravated Assault Rate | 19.3 | 7.1 | +12.2 |
| Property Crime Rate | 546.7 | 539.2 | +7.5 |
| Burglary Rate | 77.0 | 52.9 | +24.1 |
| Larceny-Theft Rate | 427.3 | 426.4 | +0.9 |
| Motor Vehicle Theft Rate | 42.4 | 59.9 | -17.6 |
All rates per 100,000 residents. Source: FBI UCR 2024.
Frequently Asked Questions
Is Lower Providence Township or New Milford safer?
New Milford is safer with a total crime rate of 567 per 100K vs 574 for Lower Providence Township — a 1% difference.
How do violent crime rates compare?
Lower Providence Township has a violent crime rate of 27.0 per 100K while New Milford has 28.2. Lower Providence Township has lower violent crime.
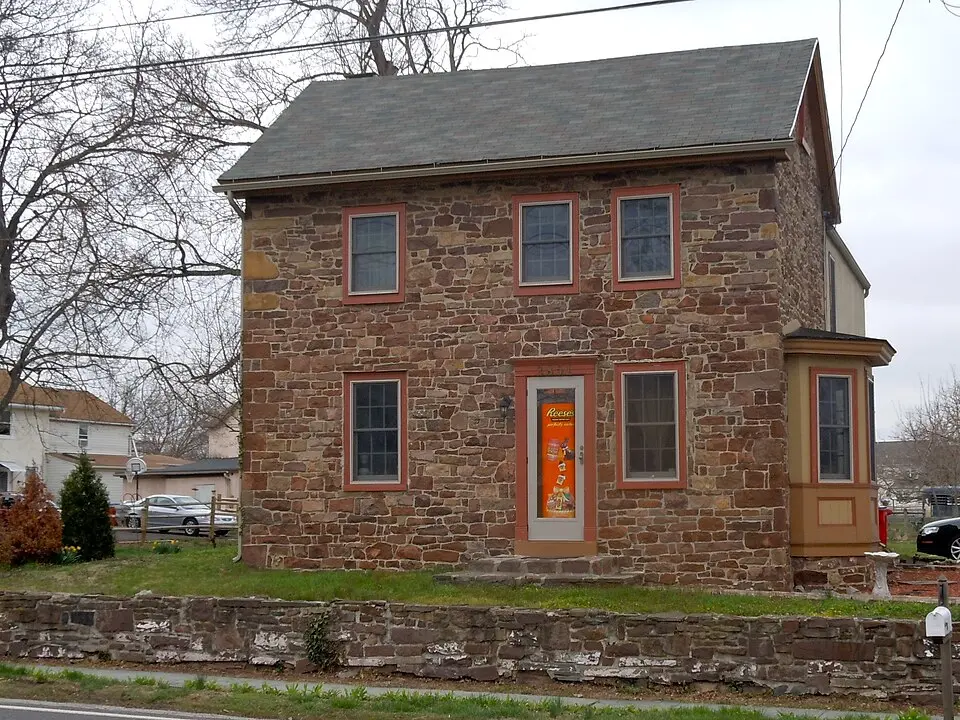
About Lower Providence Township, PA
Lower Providence Township, settled by Quakers, spans 15.5 square miles in Montgomery County, Pennsylvania. Its population of over 25,000 residents enjoys a suburban landscape along the Perkiomen Creek. With a safety score of 90/100 and a population coverage of 25,975, Lower Providence Township has a total crime rate of 573.6 per 100,000 residents.
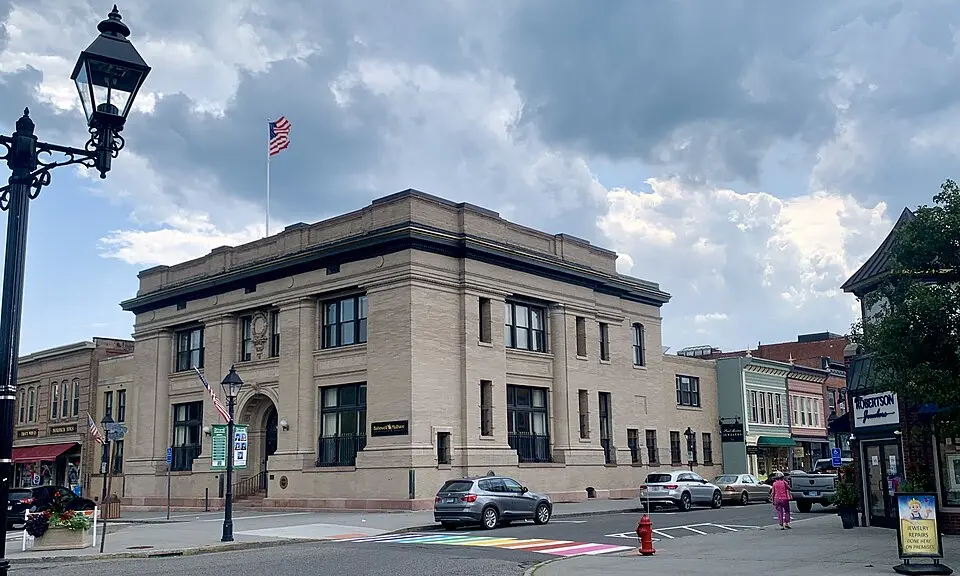
About New Milford, CT
New Milford, Connecticut, a picturesque town bisected by the Housatonic River, boasts the largest town green in the state. Its population of around 28,000 residents enjoys a blend of rural charm and suburban amenities. With a safety score of 90/100 and a population coverage of 28,377, New Milford has a total crime rate of 567.4 per 100,000 residents.
More Crime Rate Comparisons
Compare Lower Providence Township
- Is Lower Providence Township safer than New York City, NY?
- Is Lower Providence Township safer than Los Angeles, CA?
- Is Lower Providence Township safer than Chicago, IL?
- Is Lower Providence Township safer than Houston, TX?
- Is Lower Providence Township safer than Las Vegas Metro, NV?
- Is Lower Providence Township safer than Phoenix, AZ?