Is Tewksbury or Torrington Safer?
According to crimebycity.com's analysis of 2024 FBI data, Torrington is safer than Tewksbury (Safety Score 69/100 vs 69/100), with a total crime rate of 1,120 per 100,000 versus 1,125 for Tewksbury — 0% lower. Tewksbury has higher rates in 3 of 6 crime categories.
The biggest difference is in violent crime, where Torrington has a 68% lower rate.
Tewksbury — 5-Year Trend
 Violent
 Property
Total
Property
Total
Torrington — 5-Year Trend
Violent
Property
Total
Tewksbury, MA
Torrington, CT

Detailed Crime Rate Comparison
| Crime Type | Tewksbury | Torrington | Difference |
|---|---|---|---|
| Total Crime Rate | 1,124.8 | 1,120.4 | +4.4 |
| Violent Crime Rate | 254.5 | 81.4 | +173.1 |
| Murder Rate | 0.0 | 0.0 | +0.0 |
| Rape Rate | 50.3 | 14.0 | +36.2 |
| Robbery Rate | 9.4 | 25.3 | -15.8 |
| Aggravated Assault Rate | 194.8 | 42.1 | +152.7 |
| Property Crime Rate | 870.3 | 1,039.0 | -168.7 |
| Burglary Rate | 75.4 | 64.6 | +10.8 |
| Larceny-Theft Rate | 732.1 | 918.2 | -186.2 |
| Motor Vehicle Theft Rate | 62.8 | 56.2 | +6.7 |
All rates per 100,000 residents. Source: FBI UCR 2024.
Frequently Asked Questions
Is Tewksbury or Torrington safer?
Torrington is safer with a total crime rate of 1,120 per 100K vs 1,125 for Tewksbury — a 0% difference.
How do violent crime rates compare?
Tewksbury has a violent crime rate of 254.5 per 100K while Torrington has 81.4. Torrington has lower violent crime.
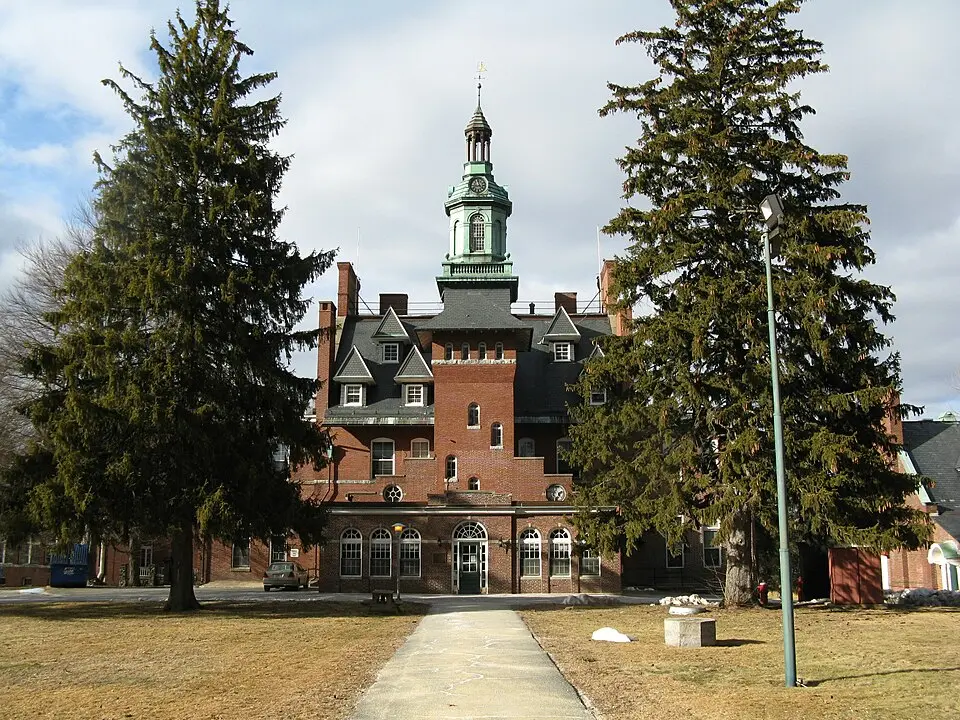
About Tewksbury, MA
Tewksbury, a town incorporated in 1734, is part of Middlesex County and home to the Tewksbury State Hospital. Located just north of Lowell, it's primarily a residential community with a population of over 30,000. With a safety score of 69/100 and a population coverage of 31,827, Tewksbury has a total crime rate of 1,124.8 per 100,000 residents.
About Torrington, CT
Nestled in the Litchfield Hills, Torrington, CT, was once a bustling mill town, reflected in its historic downtown architecture. This small city, the largest in Litchfield County, sits along the Naugatuck River. With a safety score of 69/100 and a population coverage of 35,612, Torrington has a total crime rate of 1,120.4 per 100,000 residents.