Is Northampton or Weatherford Safer?
According to crimebycity.com's analysis of 2024 FBI data, Weatherford is safer than Northampton (Safety Score 49/100 vs 49/100), with a total crime rate of 1,712 per 100,000 versus 1,717 for Northampton — 0% lower. Northampton has higher rates in 3 of 7 crime categories.
The biggest difference is in violent crime, where Weatherford has a 61% lower rate.
Northampton — 5-Year Trend
 Violent
 Property
Total
Property
Total
Weatherford — 5-Year Trend
Violent
 Property
Total
Property
Total
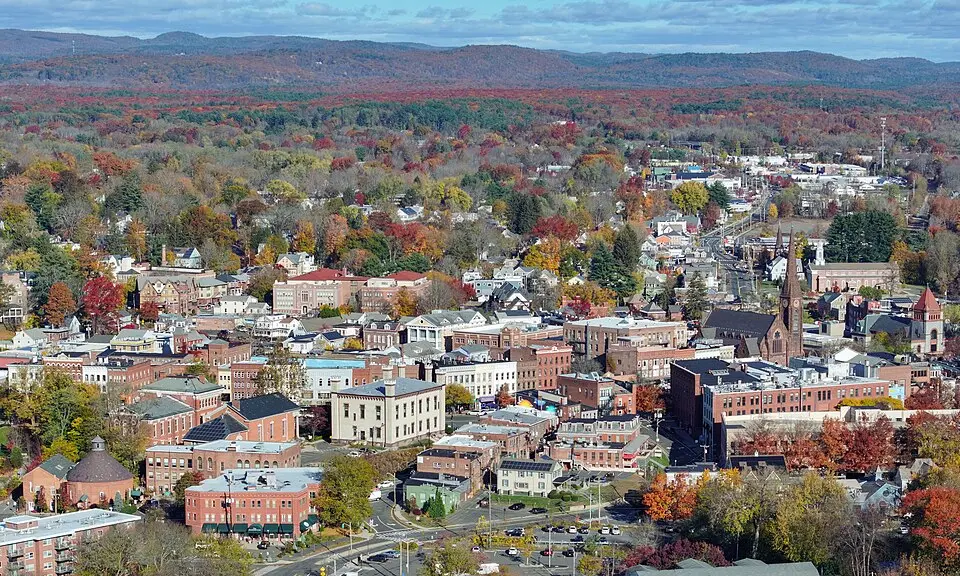
Northampton, MA
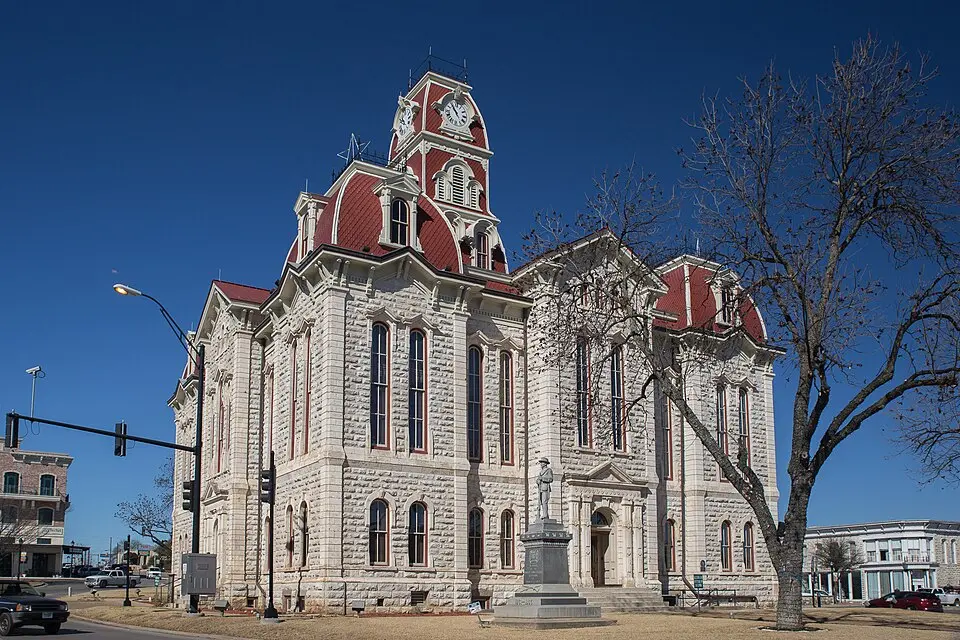
Weatherford, TX
Detailed Crime Rate Comparison
| Crime Type | Northampton | Weatherford | Difference |
|---|---|---|---|
| Total Crime Rate | 1,717.2 | 1,712.3 | +4.9 |
| Violent Crime Rate | 445.1 | 171.7 | +273.3 |
| Murder Rate | 3.3 | 2.5 | +0.9 |
| Rape Rate | 63.1 | 49.1 | +14.1 |
| Robbery Rate | 13.3 | 9.8 | +3.5 |
| Aggravated Assault Rate | 365.4 | 110.4 | +255.0 |
| Property Crime Rate | 1,272.1 | 1,540.5 | -268.5 |
| Burglary Rate | 162.8 | 139.8 | +22.9 |
| Larceny-Theft Rate | 1,069.5 | 1,297.7 | -228.2 |
| Motor Vehicle Theft Rate | 39.9 | 103.0 | -63.2 |
All rates per 100,000 residents. Source: FBI UCR 2024.
Frequently Asked Questions
Is Northampton or Weatherford safer?
Weatherford is safer with a total crime rate of 1,712 per 100K vs 1,717 for Northampton — a 0% difference.
How do violent crime rates compare?
Northampton has a violent crime rate of 445.1 per 100K while Weatherford has 171.7. Weatherford has lower violent crime.
About Northampton, MA
Nestled in the Pioneer Valley, Northampton, MA, a vibrant college town home to Smith College, boasts a progressive culture and a high proportion of residents with advanced degrees. Its historic downtown is a hub for independent businesses and the arts. With a safety score of 49/100 and a population coverage of 30,108, Northampton has a total crime rate of 1,717.2 per 100,000 residents.
About Weatherford, TX
Weatherford, the "Watermelon Capital of the World," is a city in Parker County, Texas, known for its historic downtown and annual Peach Festival. It sits west of Fort Worth, with a population exceeding 36,000. With a safety score of 49/100 and a population coverage of 40,765, Weatherford has a total crime rate of 1,712.3 per 100,000 residents.